Tuesday, December 11

What is Capital Market and Source of Fund to Raise Capital

Leave a Comment
Capital markets involve two parties on either end of a financial transaction. On one side, there are investors with capital who want to earn a return on their money. On the other, there are the companies, governments, or individuals who need to raise money.Capital marketsThe capital market, allow these two groups to come together so that both can meet their goals. Capital markets are an essential part of many countries’ economies,making it possible for businesses to grow, for governments to provide essential services, and for individuals to invest and build their assets.
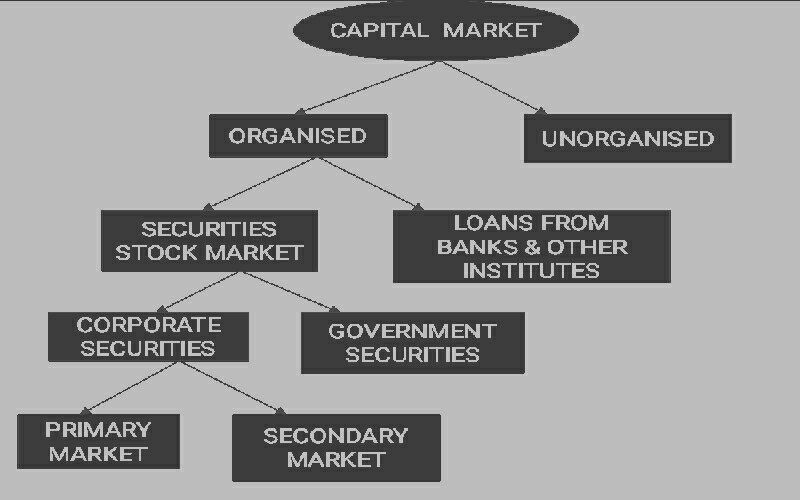
The bigger and more robust a country’s capital markets are, the more investment vehicles there typically are and the larger the potential investment capital that is available to fuel growth. At the same time, most capital markets are regulated, by the government, the markets themselves, or by both.

The goal is to increase investor confidence, and, by extension, investor participation. Achieving it often depends on the perception that everyone has equal access to good information and the best prices.
  • What is capital market?

Capital markets are the mechanism that allows the exchange of money between companies and investors, companies and banks, and investors and banks as each party seeks to raise capital or put capital to work.

While companies generally rely on their sales to keep their businesses going and on profits to underwrite new growth, there are times when a company might need a large amount of capital, perhaps to expand operations or cover operating losses. The capital markets are a place to raise that money, letting companies offer ownership or promise repayment to investors in exchange for capital.

The capital markets also enable individuals to buy a home, pay for college, or start a business. They can take a loan from a bank that lends its depositors’ money to borrowers in exchange for the promise of future repayment and interest.
It might help to think of the bank in this case as the investor, providing an individual with capital. In both cases, the availability of capital can contribute to economic growth. Expanding businesses typically create new jobs, putting more money into circulation.

Home buyers spend money to remodel and furnish their properties, creating or sustaining jobs. Of course, in any economy there are periods when investment capital dries up and the economy slows down — or when too much capital encourages inflation. Left unchecked by government or industry oversight, either situation could create serious problems.
Read Also :
The capital market offer companies many different ways to raise funds from many different investors, including individuals and large institutions. Usually, the first options an entrepreneur explores are private sources of funds. This part of the capital market may provide limited amounts of money, but allows companies to remain privately held and founders to retain control over their operations.

One private option is a corporate loan or line of credit from a bank. The process of qualifying is similar to what you might be familiar with if you’ve arranged a mortgage or large loan.
Based on a company’s financial history and prospects, a bank may determine that the company is likely to repay the loan plus interest and advances the company the money.

Another private option is to tap friends and family — private individuals who have some affiliation with the company or its officers and are willing to take investment risk for a share of future profits.
A third choice is venture capital, or the assets of private investors channeled through a professional investment firm that may add funds to a start-up or maturing company in exchange for a piece of ownership, some say over operations, and a share in the profits.

Public sources of funds

When companies need a greater amount of capital than their earnings or private sources can provide, they may turn to the public capital markets. In the U.S., that means going to Wall Street — shorthand for the financial markets. Issuing stock and bonds are the primary public ways of raising capital.

A company that issues stock sells shares of ownership in the company and becomes publicly held. That means the company has a fiscal responsibility to its shareholders, who have a vote in how the company is run and a right to benefit from the company’s success.

Once a company is publicly held it can also issue bonds to borrow money from investors, taking on the responsibility to repay the capital at some point in the future and pay interest for its use. Public sources of funds in the capital markets generally involve far greater sums than private sources. But using this money means that a company takes on a number of new responsibilities in exchange for the cash infusion.

When companies are raising funds:

There are benefits to using a combination of methods. A company might take a loan when starting up, or work with venture capitalists that invest in the company. Several years later they may go public by issuing stock to expand into new markets, and then issue bonds at some time after that to cover the cost of upgrading equipment.

The availability of several methods to raise funds is appealing to companies because it means they can continue to tap new sources of money over time. And by choosing several ways to raise funds, it’s possible to balance the advantages and disadvantages of each method. For example, a publicly held company may issue bonds to raise additional funds because issuing more stock would dilute the value of existing stock, upsetting current shareholders.

Companies can also look to international capital markets. Some countries may offer better opportunities for raising capital than others, since there may be more potential investors in one country than in another. For example, a company in a small or developing nation might face a limited domestic capital market, so it could choose to offer shares to the much larger pool of investors through American Depositary Receipts (ADRs) traded in the United States, or Global Depositary Receipts (GDRs) traded in markets around the world.

On the other hand, a European company might raise capital internationally by issuing bonds in a country with lower interest rates than it might have to pay at home, reducing the cost of raising the capital.
Read More

Saturday, November 24

Capital Structure in Financial Management

Leave a Comment

What is a capital structure?

Capital means funds employed in business for a period of twelve months and above. Capital excludes short-term funds employed in funds, i.e., working capital. Working capital is employed for a short time and hence ignored. Capital structure gives us the various components of capital both debt capital and share capital.

In short, capital structure tells us about how much funds have been brought into business and in what form? It gives us the relationship between debt and equity, known as debt to equity relationship.

What is the need for a capital structure?

Why do we need a capital structure? Cant we do without it? In other words, cant we only have equity or debt instead of both the components? We can, especially equity.

One can have a business enterprise only with equity funds without taking any loans. However, the financial risk that he will be taking would be tremendous, without anybody to share it with.

Referring to debt,we cannot have a business enterprise only with debt. It is impossible as no lender would be willing to give entire amount by way of loan.

Any lender wants the owner to put in some money by way of equity share capital so that the balance funds can be given in the form of loans. The market norm for lending is debt to equity not to exceed 2:1. There would be very few exceptions when this would be higher than 2:1.

To sum up, any business enterprise would have what is known as capital structure. It is advisable for a business enterprise to have both debt and equity components in its capital structure although it is possible to run the business entirely on equity. Further as we have seen in the on leverages, it is beneficial to have a mix of debt and equity as it increases the Earnings Per Share (EPS) to the shareholders.

At the same time, having regard to increasing risk due to increasing debt, it is better to be within the lending norms of 2:1. (Example Rs. 100 lacs by ways of equity and Rs. 200 lacs by way of debt).

Components of a capital structure exclusion of current liabilities and reasons thereof

Share capital:
  • Equity share capital
  • Retained earnings
  • Preference share capital
Debt capital:
  • Debentures
  • Loans
  • Fixed deposits from the public
  • Medium term acceptances for capital goods
  • Bonds
  • Unsecured loans from promoters, friends and relatives
  • Deferred Payment Guarantees
  • Hire Purchase Financing
(The above list is not exhaustive. It is only illustrative.)

Exclusion of current liabilities and reasons thereof
  • They are employed in business for a short period and cannot be considered as part of capital,
  • Some of them do not have any cost attached to them advances received, provision for outstanding expenses, provision for tax, creditors outstanding etc. Whereas all the items of debt capital have interest cost attached to them.
  • In a healthy business enterprise, they are fully covered by current assets and met out of current assets example creditor gets paid out of realisation of sale bill outstanding as a debtor.
Hence strictly speaking, current liabilities are not considered as capital

Factors affecting capital structure or determinants of capital structure

  • The profitability of the organisation the higher the profits more the chances for debt capital because of ability to service higher debt both by way of interest and repayment of principal amount. This is reflected in a very critical ratio called Interest coverage ratio i.e EBIT/I. The higher the ratio, the more the chances of debt in the capital structure.

  • Reliable cash flows the more they are reliable the more the lenders are willing to give debt capital to the enterprise. Once debt is taken cash outflows get fixed for the future. Accordingly the reliability of firms cash flows assumes great significance here.

  • Degree of risk associated with the enterprise the higher the risk less the chances of debt capital and more the chances of equity. Example IT idustry (at least in the late 90s in India) run predominantly on equity.

  • Managements risk aversion attitude conservative managements take less of external debt and try to utilise internal accruals to maximum extent and equity to the extent necessary; on the contrary aggressive managements go in for debt to a larger extent. Examples Sundaram group of companies in Chennai in general and Sundaram Claytons in particular conservative attitude towards debt and debt to equity ratio being less than 1:1. On the contrary, Essar oils have very high debt to equity ratio close to 3:1.

  • Whether the business enterprise enjoys tax concessions in a big way like till recently the IT industry? Owing to high level of exports the IT sector was enjoying 100% tax concession on the exports profits. There was no difference in cost of debt (interest) and cost of equity (primarily dividend) in the absence of taxes. Such enterprises are indifferent to debt and have more of equity only.

  • Availability of different kinds of debt instruments like deep discounted bonds, floating rate notes (where the rate of interest is adjusted to the market rates) etc. that are attractive to the enterprises to go in for maximum debt within the debt to equity ratio norms specified by the lenders or the market. These instruments have entered the market only in the 90s and hence the debt market is getting more and more attractive and limited companies have started using them instead of only depending upon institutional finance.

  • Attitude of the promoters towards financial and management control - if this is high, first preference would be given for debt and then preference shares. Last preference would be given for public equity where financial control gets diluted because of larger number of shareholders and managerial control is likely to be affected.

  • Nature of the industry more competitive = higher equity and less debt; More monopolistic = less equity and more debt. Further depending upon the nature of industry the lenders do have different lending norms. This means that the leverage ratios in a particular industry are more or less uniform. These serve as the benchmark for determining the capital structure for any unit in the industry
Read More

Thursday, November 1

Correlation between the returns of two different securities in Portfolio

Leave a Comment
We should not ignore the relationship or correlation between the returns of two different securities in Portfolio. This correlation however has no impact on the portfolios expected return.
return of securities in portfolio

The portfolio expected return is a straightforward weighted average of returns on the individual securities; the portfolio standard deviation is not the weighted average of individual security standard deviations.

Let's understand correlation between securities in Portfolio:

Suppose we have two stocks A and B in our portfolio. During a given period the return of A increases say by 1% while that of B increases by 0.5% in the same period.

This means that both are moving positively in the direction of increasing returns. This is described as positive correlation. However the quantum of increase is not the same in both the cases.

Hence this is imperfect but positive correlation. In case the quantum of increase is 1% in both the cases, then the correlation is said to be positive and perfect correlation.

If the returns move in the opposite direction, say one increasing and the other decreasing, then the correlation is negative. Still the relationship could be perfect in the sense that the quantum of increase in return say in the case of A is the same in the case of B but in the opposite direction. This means that while stock A has increased its return, stock B has lost its return by the same percent.

Let us try to put these in the form of equations.
“Δ” represents the increase in return and (“Δ”) (within brackets-indicate that the return is decreasing).

Keeping these in mind let us attempt the following:
Δ of stock A = 1% for a given period = Δ of stock B = perfect and positive correlation

Δ of stock A = 1% for a given period; Δ of stock B = greater than or less than 1% but the return has increased and not decreased = positive but imperfect correlation

Δ of stock A = 1% for a given period; (“Δ”) of stock B = 1%. Then stock A and stock B are said to have perfect but negative correlation.

Δ of stock A = 1% for a given period; (“Δ”) of stock B less than or more than 1%. Then stock A and stock B are said to have imperfect and negative correlation.

We have consciously omitted the fifth possibility of both the stocks A and B losing to the same percent during a given period.

Any portfolio would avoid such stocks unless the future is going to be completely different in which case the past is not the basis on which stock selection is being made.

We have also tried to present these concepts in as simple a manner as possible. You are advised to go through these repeatedly to grasp the essence of the underlying concept in correlation between one stock and another. This is required because the concept of correlation is the fundamental based on which the selection of stocks for a portfolio is done. You will appreciate that positive correlation between two stocks would mean increased risk especially if the relationship is perfect. Negative correlation stocks are not desirable.

What is then left is positive but imperfect correlation. The risk-averse investors would invariably choose such stocks as show positive relationship between them (or among them in view of the number of stocks in a portfolio being more than 2, which is usually the case) but not perfect relationship. Then only the risk in a portfolio is reduced. For a given period, same degree of movement in return on different stocks in the same direction only increases the risk in a portfolio.

Now going back to the standard deviation of a portfolio, we will appreciate that it is not merely the weighted average of the standard deviation numbers for each stock in the portfolio. Suppose there are five stocks in a portfolio. We can appreciate that there are quite a few possible combinations of these five stocks depending upon the proportion of investment in each of them; for each combination, the weighted average of the standard deviation numbers has to be etermined first and then the ultimate average standard deviation should be found out for all possible combinations.

This involves a very complicated calculation and hence not presented here. However before we end this topic it should be mentioned that the complicated calculation is worth the time invested in, as the ultimate result is reduction in the total risk of the portfolio. This is the very objective of a portfolio.

Kinds of risk - diversifiable and non-diversifiable

Diversifiable or non-systemic risks

A portfolio aims at minimising the risk and optimising the returns. Any portfolio chooses the constituent stocks based on certain parameters and one of the important parameters is the correlation among the various stocks. A portfolio diversifies the risk by choosing stocks of:
  • Different sectors
  • Different units in the same sector
  • Different aturities and different instruments including money market.
Are there different kinds of risk associated with securities? Yes. Diversifiable and non-diversifiable risks. By choosing different sectors etc. we are diversifying the risks. This means that sector specific or industry specific or instrument specific or maturity specific risks are diversifiable.

Let's explain this through examples.

Your portfolio could contain stocks of Cement, Textiles, Software and Pharmaceuticals. This is called sector diversification. You will choose such sectors as are not having perfect correlation.

Your portfolio could contain stocks of ACC, Larsen & Toubro and Dalmia Cements. This is called unit diversification in the same sector. You will choose again such units as are not having perfect correlation.

Your portfolio could contain one-year investment (bond or debenture), more than one-year investment and long-term investment too. This is called maturity diversification. Here the relationship will rarely be perfect.

Your portfolio could contain investment into equity shares, debt instruments and money market instruments. This is called instruments diversification. Here too the relationship will not be perfect as these relate to different segments of the Financial Markets.

All the above are examples of diversifiable risks. One can use detailed analytical study of the past trends and knowledge about the various sectors and specific units for true diversification of stocks in a portfolio. Such diversifiable risks are often referred to as non-systemic risks or specific risks as such risks are not thrown in by the system.

Non-diversifiable or systemic risks
Suppose we do all the above and arrive at a very good portfolio. The US and their allies decide to bomb IRAQ. All hell breaks loose. All the markets internationally are nervous.

Can you and I do something about it besides feeling helpless about the whole thing? Such kind of risks could be specific to a country or economy or universal in its impact.

The universality of market risks depends upon the degree of integration of different countries into the global system. The more they are integrated the higher will be the degree of uniformity of impact due to US bombing IRAQ. We cannot diversify this kind of risk at least within a country or system, although global investors are in a better position to diversify the country specific risk by pulling out of the country and reinvesting the amount in less risky markets.

Typical example of a market risk in India Sensex crashing from 6000 odd points in early 2000 to less than 3000 points in 2002. The markets becoming nervous on news of Indo-Pak war is another example.

Total risk of a portfolio = market risk of the portfolio + specific risk of the portfolio
Read More

What is Cash Budget and its Purpose,Objectives and Need

Leave a Comment
What is Cash Budget and its Purpose,Objectives and Need : The net cash position of a firm as it moves from one budgeting sub period to another is highlighted by the cash budget. Cash budget is a statement showing the estimated cash inflows and cash outflows over the planning horizon.

The various purpose of cash budget are:

  • To coordinate the timing of cash need.
  • It pinpoints the period when there is likely to be excess cash.
  • It enables the firm which has sufficient cash to take the advantage of cash discount on its account payable to pay the obligations when due to formulate the dividend policy.
  • It help to arrange needed funds so that the most favourable terms and prevents the accumulation of excess funds.
The principle aim of cash budget as a tool to predict cash flows over a given period of time is to ascertain whether at any point of time there is likely to be an excess or shortage of cash.

The preparation of cash budgets involves various steps and is called the element of cash budgeting system. The first element is selection of period of time to be covered by the entire budget. It is referred to as the planning horizon which mean the time span and the sub period within that time span and the sub period within that time span over which the cash flows are to be protected.

The second element of cash budget is the selection of the factors that have a bearing on cash flows. The items included in the cash budget are only cash items. The factors that generate cash flows are generally divided for the purposes of preparing cash budget into two broad categories: (a) operating (b) financial.

While the former category includes cash flows generated by the operations of the firms and are known as operating cash flows.

Cash Budget And Cash Flows Statement

Cash budget is a statement showing the estimated cash inflows and cash outflows over the planning horizon. In other words, The net cash position of a firm as it moves from one budgeting sub period to another is highlighted by the cash budget.
Cash Flow Statement generally prepared annually, which shows the sources and the uses of cash during that period. It measures the changes in the financial position on each basis.

Cash Budget Objectives

  • To coordinate the timing of cash need.
  • It pinpoints the period when there is likely to be excess cash.
  • It enables the firm which has sufficient cash to take the advantage of cash discount on its account payable to pay the obligations when due to formulate the dividend policy.
  • It help to arrange needed funds so that the most favourable terms and prevents the accumulation of excess funds.
Cash Flow Statement Objectives
  • Cash Flow Statement is useful for the management to assess its ability to meet the obligation to trade creditors and to pay bank loan to pay interest to debenture holders and dividend to its shareholders.
  • Cash Flow Statement can also be prepared month wise which is useful in presenting the information of excess cash in some months and shortage of cash in other months.

Need For Preparing A Cash Budget

The principle aim of preparing a cash budget, as a tool to predict cash flows over a period of time is to ascertain whether at any point of time there is likely to be an express or shortage of cash.

The preparation of cash budget involved various steps. They may be described as the elements of the cash budgeting system.

Cost of Capital
The cost of capital is the rate of return the company has to pay to various suppliers of funds in the company. There are variations in the costs of capital due to the fact that different kinds of investment carry different levels risk which is compensated for by different levels of return on the investment.

Opportunity Cost of Capital
When an organization faces shortage of capital and it has to invest capital in more than one project, then the company will meet the problem by rationing the capital to projects whose returns are estimated to be more. The firm might decide to estimate the opportunity cost of capital in other projects.

Financial Leverage
This ratio indicates the effects on earnings by rise of fixed cost funds. It refers to the use of debt in the capital structure. Financial leverage arises when a firm deploys debt funds with fixed charge.

Operating Leverage
Operating leverage is concerned with the operation of any firm. The cost structure of any firm gives rise to operating leverage because of the existence of fixed nature of costs. This leverage relates to the sales and profit variations. Sometimes a small fluctuation in sales would have a great impact on profitability. This is because of the existence of fixed cost elements in the cost structure of a product.

Combined Leverage
The operating leverage has its effects on operating risk and is measured by the
percentage change in EBIT due to percentage change in sales. The financial
leverage has its effects on financial risk and is measured by the percentage change in EPS due to percentage change in EBIT. Since both these leverages are closely concerned with ascertaining the ability to cover fixed charges, if they are combined, the result is total leverage and the risk associated with combined leverage is known as total risk.
Read More

Ratio Analysis : Advantages and Limitations in Financial Management

Leave a Comment
Ratio Analysis : Advantages and Limitations in Financial Management

What is Ratio Analysis :

Ratio analysis is the method or process by which the relationship of items or groups of items in the financial statements are computed, determined and presented.

Ratio analysis is an attempt to derive quantitative measures or guides concerning the financial health and profitability of the business enterprise. Ratio analysis can be used both in trend and static analysis.

There are several ratios at the disposal of the analyst but the group of ratios he would prefer depends on the purpose and the objectives of the analysis.

Accounting ratios are effective tools of analysis. They are indicators of managerial and overall operational efficiency. Ratios, when properly used are capable of providing useful information.
Ratio analysis is defined as the systematic use of ratios to interpret the financial statements so that the strengths and weaknesses of a firm as well as its historical performance and current financial condition can be determined the term ratio refers to the numerical or quantitative relationship between items/ variables.

This relationship can be expressed as:

1) Fraction

2) Percentages

3) Proportion of numbers
These alternative methods of expressing items which are related to each other are, for purposes of financial analysis, referred to as ratio analysis. It should be noted that computing the ratio does not add any information in the figures of profit or sales.
What the ratios do is that they reveal the relationship in a more meaningful way so as to enable us to draw conclusions from them.

ADVANTAGE OF RATIO ANALYSIS :

  • Ratios simplify and summarize numerous accounting data in a systematic manner so that the simplified data can be used effectively for analytical studies.
  • Ratios avoid distortions that may result the study of absolute data or figures.
  • Ratios analyze the financial health, operating efficiency and future prospects by inter-relating the various financial data found in the financial statement.
  • Ratios are invaluable guides to management. They assist the management to discharge their functions of planning, forecasting, etc. efficiently.
  • Ratios study the past and relate the findings to the present. Thus useful inferences are drawn which are used to project the future.
  • Ratios are increasingly used in trend analysis.
  • Ratios being measures of efficiency can be used to control efficiency and profitability of a business entity.
  • Ratio analysis makes inter-firm comparisons possible. i.e. evaluation of interdepartmental performances.
  • Ratios are yard stick increasingly used by bankers and financial institutions in evaluating the credit standing of their borrowers and customers.

LIMITATIONS OF RATIO ANALYSIS:

An investor should caution that ratio analysis has its own limitations. Ratios should be used with extreme care and judgment as they suffer from certain serious drawbacks.

Some of them are listed below:

1. Rations can sometimes be misleading if an analyst does not know the reliability andsoundness of the figures from which they are computed and the financial position of the business at other times of the year.
A business enterprise for example may have an acceptable current ratio of 3:1 but a larger part of accounts receivables comprising a great portion of the current assets may be uncollectible and of no value. When these are deducted the ratio might be 2:1.

2. It is difficult to decide on the proper basis for comparison. Ratios of companies have meaning only when they are compared with some standards. Normally, it is suggested that ratios should be compared with industry averages. In India, for example, no systematic and comprehensive industry ratios are complied.

3. The comparison is rendered difficult because of differences in situations of 2 companies are never the same. Similarly the factors influencing the performance of a company in one year may change in another year.
Thus, the comparison of the ratios of two companies becomes difficult and meaningless when they are operation in different situations.

4. Changes in the price level make the interpretations of the ratios Invalid.

The interpretation and comparison of ratios are also rendered invalid by the changing value of money.

The accounting figures presented in the financial statements are expressed in monetary unit which is assumed to remain constant. In fact, prices change over years and as a result.

Assets acquired at different dates will be expressed at different values in the balance sheet. This makes comparison meaningless.

For e.g. two firms may be similar in every respect except the age of the plant and machinery. If one firm purchased its plant and machinery at a time when prices were very low and the other purchased when prices were high, the equal rates of return on investment of the two firms cannot be interpreted to mean that the firms are equally profitable.

The return of the first firm is overstated because its plant and machinery have a low book value.

5. The differences in the definitions of items, accounting, policies in the balance sheet and the income statement make the interpretation of ratios difficult.

In practice difference exists as to the meanings and accounting policies with reference to stock valuation, depreciation, operation profit,current assets etc.

Should intangible assets be excluded to calculate the rate of return on investment? If intangible assets have to be included, how will they be valued? Similarly, profit means different things to different people.

6. Ratios are not reliable in some cases as they many be influenced by window/ dressing in the balance sheet.

7. The ratios calculated at a point of time are less informative and defective as they suffer from short-term changes. The trend analysis is static to an extent.

The balance sheet prepared at different points of time is static in nature. They do not reveal the changes which have taken place between dates of two balance sheets. The statements of changes in financial position reveal this information, bur these statements are not available to outside analysts.

8. The ratios are generally calculated from past financial statements and thus are no indicator of future. The basis to calculate ratios are historical financial statements. The financial analyst is more interested in what happens in future.
Read More